A Procura.

A procura.
More Posts from Ritasakano and Others
Perspective


Pinpointing the Cause of Earth’s Recent Record CO2 Spike
A new NASA study provides space-based evidence that Earth’s tropical regions were the cause of the largest annual increases in atmospheric carbon dioxide concentration seen in at least 2,000 years.
What was the cause of this?
Scientists suspect that the 2015-2016 El Niño – one of the largest on record – was responsible. El Niño is a cyclical warming pattern of ocean circulation in the Pacific Ocean that affects weather all over the world. Before OCO-2, we didn’t have enough data to understand exactly how El Nino played a part.

Analyzing the first 28 months of data from our Orbiting Carbon Observatory (OCO-2) satellite, researchers conclude that impacts of El Niño-related heat and drought occurring in the tropical regions of South America, Africa and Indonesia were responsible for the record spike in global carbon dioxide.

These three tropical regions released 2.5 gigatons more carbon into the atmosphere than they did in 2011. This extra carbon dioxide explains the difference in atmospheric carbon dioxide growth rates between 2011 and the peak years of 2015-16.

In 2015 and 2016, OCO-2 recorded atmospheric carbon dioxide increases that were 50% larger than the average increase seen in recent years preceding these observations.

In eastern and southern tropical South America, including the Amazon rainforest, severe drought spurred by El Niño made 2015 the driest year in the past 30 years. Temperatures were also higher than normal. These drier and hotter conditions stressed vegetation and reduced photosynthesis, meaning trees and plants absorbed less carbon from the atmosphere. The effect was to increase the net amount of carbon released into the atmosphere.

In contrast, rainfall in tropical Africa was at normal levels, but ecosystems endured hotter-than-normal temperatures. Dead trees and plants decomposed more, resulting in more carbon being released into the atmosphere.

Meanwhile, tropical Asia had the second-driest year in the past 30 years. Its increased carbon release, primarily from Indonesia, was mainly due to increased peat and forest fires - also measured by satellites.

We knew El Niños were one factor in these variations, but until now we didn’t understand, at the scale of these regions, what the most important processes were. OCO-2’s geographic coverage and data density are allowing us to study each region separately.
Why does the amount of carbon dioxide in our atmosphere matter?
The concentration of carbon dioxide in Earth’s atmosphere is constantly changing. It changes from season to season as plants grow and die, with higher concentrations in the winter and lower amounts in the summer. Annually averaged atmospheric carbon dioxide concentrations have generally increased year over year since the 1800s – the start of the widespread Industrial Revolution. Before then, Earth’s atmosphere naturally contained about 595 gigatons of carbon in the form of carbon dioxide. Currently, that number is 850 gigatons.

Carbon dioxide is a greenhouse gas, which means that it can trap heat. Since greenhouse gas is the principal human-produced driver of climate change, better understanding how it moves through the Earth system at regional scales and how it changes over time are important aspects to monitor.

Get more information about these data HERE.
Make sure to follow us on Tumblr for your regular dose of space: http://nasa.tumblr.com.
Fofis!!!


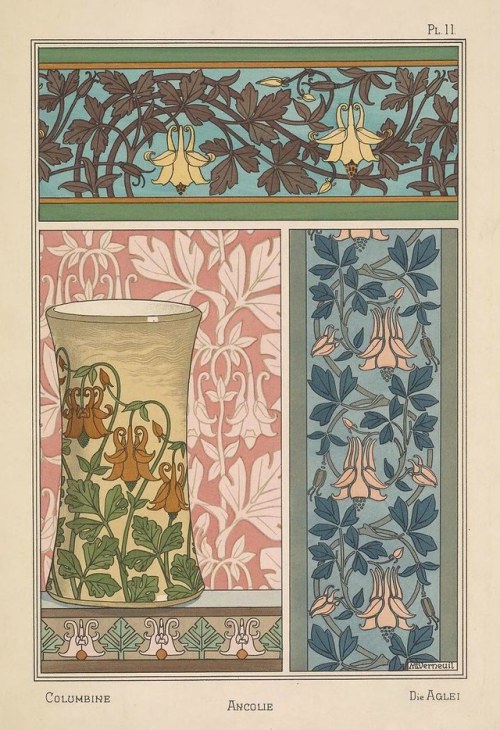


Eugène Grasset, Plants and Their Application to Ornament, 1896
Archive.org and Gallica.bnf.f
Orion e a explosão de uma estrela.

ALMA views a stellar explosion in Orion
Stellar explosions are most often associated with supernovae, the spectacular deaths of stars. But new ALMA observations of the Orion Nebula complex provide insights into explosions at the other end of the stellar life cycle, star birth. Astronomers captured these dramatic images of the remains of a 500-year-old explosion as they explored the firework-like debris from the birth of a group of massive stars, demonstrating that star formation can be a violent and explosive process too.
The colours in the ALMA data represent the relative Doppler shifting of the millimetre-wavelength light emitted by carbon monoxide gas. The blue colour in the ALMA data represents gas approaching at the highest speeds; the red colour is from gas moving toward us more slowly.
The background image includes optical and near-infrared imaging from both the Gemini South and ESO Very Large Telescope. The famous Trapezium Cluster of hot young stars appears towards the bottom of this image. The ALMA data do not cover the full image shown here.
Credit: ALMA (ESO/NAOJ/NRAO), J. Bally/H. Drass et al.
As pétalas voam Pousando suavemente Nos cabelos Forrando tudo de rosa suave Mansamente

VISIONS OF SPRING: CHERRY BLOSSOMS
SPRING IS THERE, CATCH A GLIMPSE A LOT OF MY FOLLOWERS, SOME VERY DEAR ONES SEEM NOT TO BE WELL RIGHT NOW. MY OWN HEALTH AND MOOD ARE PRETTY BAD SINCE THE LAST FEW MONTHS. DON’T GIVE UP PLEASE, NEITHER WILL I, PROMISE. SPRING IS THERE. TRY TO GO OUTSIDE, TAKE A DEEP BREATH. LET YOURSELF GO, AT LEAST FOR A MINUTE. MAYBE TAKE A FEW SNAPSHOTS AS A REMINDER. IT WILL HELP A LOT. HUGS :-D:-D:-D:-D
Novaexpress93

Novas possibilidades ao nosso alcance.
81-Yo Japanese Woman Who Taught Herself Programming Launches First iPhone Game

Tech-savvy Masako Wakamiya might be 81-years-old, but she is anything but a ‘typical’ senior citizens. Recently, the Japanese citizen launched her first iPhone app, and she’s now on a mission to show other older individuals that they, too, can learn coding or another trade.
Continuar lendo
Seis anos do Grande terremoto de Tohoko!!


